
Read full research article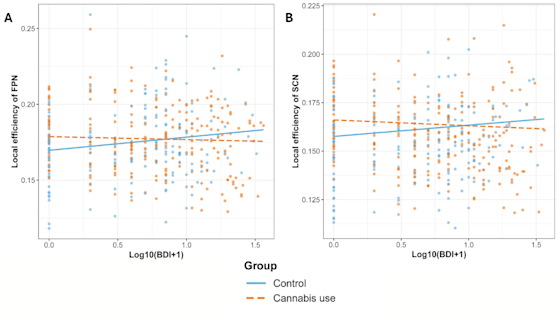
OVERVIEW
Researchers from UT Dallas and Erasmus University Rotterdam analyzed brain imaging data from 395 adults ranging in age from 18 to 55 years, drawn from four research sites across the United States and the Netherlands. Of these participants, 223 were current weekly cannabis users and 172 were non-using controls. Depression symptoms were measured using the Beck Depression Inventory (BDI-II), capturing a spectrum from minimal to severe levels across both groups. Using advanced brain imaging (resting-state fMRI) and graph theory analysis — a powerful method for mapping the brain's communication networks — researchers discovered that cannabis users showed measurably more integrated and efficient brain network function compared to non-users. However, this effect was significantly diminished when depression symptoms entered the picture.“”
THE AUTHORS CONCLUDE
"The co-occurrence of depression symptoms and cannabis use, compared to cannabis use alone, may be associated with less efficient and less integrated brain network function."
In plain terms: Cannabis use alone appeared to alter brain connectivity in one direction, but depression symptoms pulled that effect back — suggesting the two conditions interact in ways that leave the brain operating in a more compromised state than either condition alone would predict.The interaction was most pronounced in global brain network measures and was also observed in key networks governing decision-making, emotional regulation, reward processing and behavioral control — including the frontoparietal and subcortical networks. These findings underscore the importance of examining cannabis use and depression not in isolation, but as interacting variables that together produce a distinct neurofunctional profile — a critical consideration for both clinical practice and the design of future neuroimaging research.EXCERPT from Fig. 3: The interaction between depression symptoms and cannabis group on local graph measures of frontoparietal network (FPN) and subcortical network (SCN) (without FDR correction). PICTURED: A. and B. Depression symptoms moderated the effect of group on local efficiency of FPN and SCN, respectively. NOT PICTURED: C. and D. Depression symptoms moderated the effects of group on clustering coefficient of SCN.