Read full research articleLittle is known about how the brain alleviates one of the most frequent symptoms of traumatic brain injury (TBI) – depression, yet cognitive training hold promise for advancing research and interventions. This study investigated the effects of cognitive training in chronic TBI, including the brain mechanisms of reduced depressive symptoms post-training. 79 individuals with chronic TBI participated in eight weeks of either strategy- or information-based cognitive training. Researchers measured psychological functioning, cortical thickness and resting-state functional connectivity (rsFC) pre-training, post-training, and 3 later. Researchers note a correlation between reduced depressive symptoms in TBI and cognitive training (not specialized for psychiatric symptoms). Improved scores include post-traumatic stress disorder, TBI symptom awareness and functional status. Increases in cortical thickness and decreases in rsFC suggest future research apply these traits as neuroimaging markers to advance measurement of training-induced improvements. 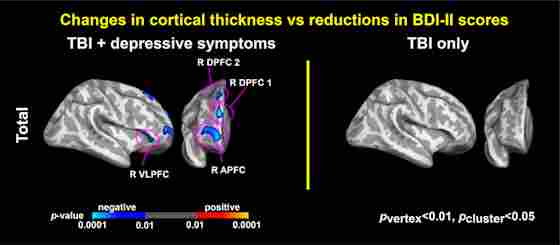
Associations between depressive symptoms and cortical thickness. Colormaps represent statistically significant associations of reduced BDI–II total scores with increased cortical thickness over time (pvertex < .01, pcluster < .05). R = right; VLPFC = ventrolateral prefrontal cortex; APFC = anterior prefrontal cortex; DPFC = dorsal prefrontal cortex [Color figure can be viewed at wileyonlinelibrary.com]